5 Ways to Boost Your Gas Agency Profits with Analytics
Unlock hidden revenue and trim wasteful operational expenses using real-time management data.
LPG VAYAPAR Team
Business Analytics Specialist
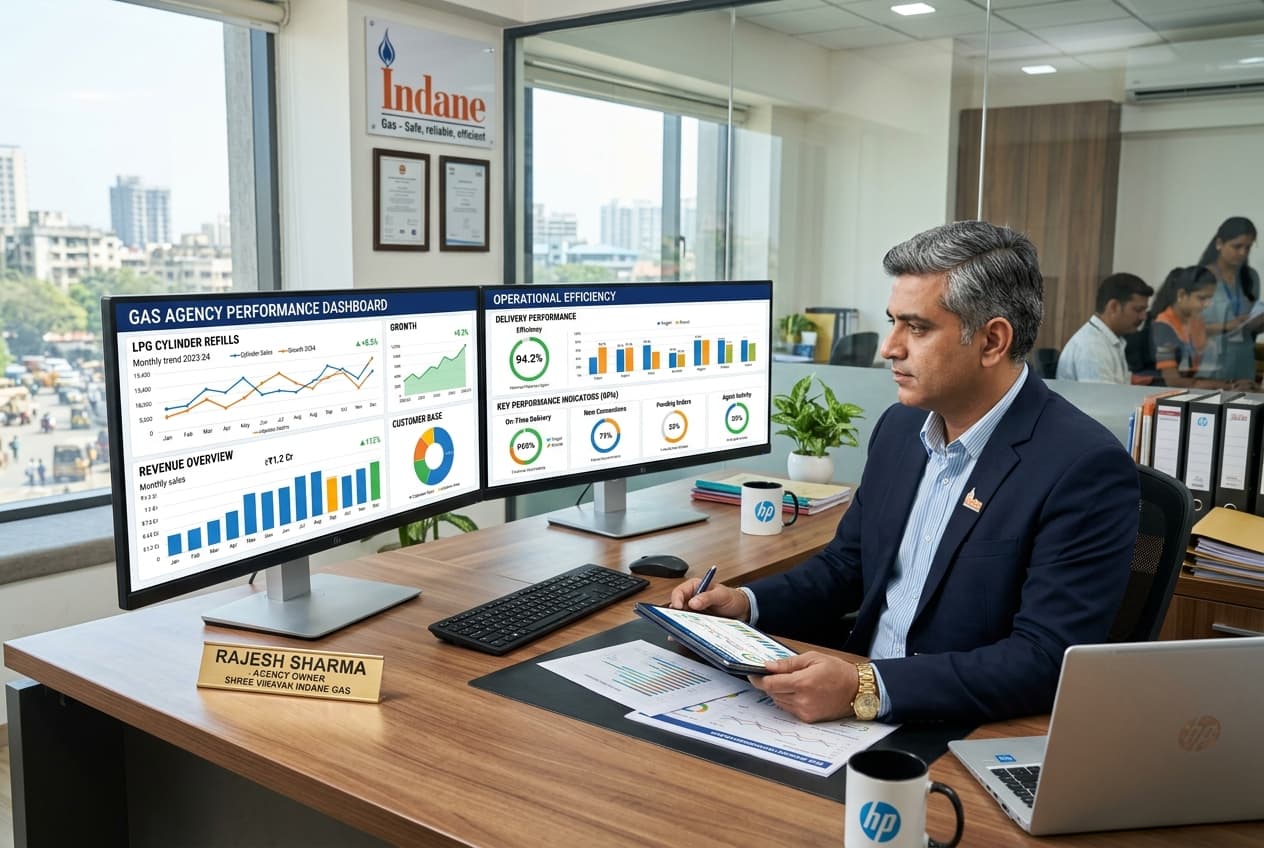
- Distributors often assume LPG margins are fixed by oil companies, overlooking substantial cost-saving opportunities.
- Vehicle route density analysis can reduce agency fuel expenditure by 20% to 35%.
- Tracking commercial cylinder turnaround times recovers dormant capital and prevents cylinder hoarding.
- Staff delivery velocity KPIs help identify top performers and incentivize productivity.
Why Top LPG Distributors Run on Numbers, Not Intuition
Many gas agency owners believe their net profit is entirely constrained by government commissions per cylinder. However, the most profitable agencies in India understand that net margin is determined by operational efficiency, turnaround velocity, and non-gas accessory sales.
Without analytics, you cannot easily identify which delivery routes consume disproportionate fuel, which commercial accounts are chronically overdue, or which delivery staff have the highest first-attempt delivery success rate.
The Profit Margin Reality
While gross commissions are standard, operating expenses range between 35% and 65% of revenue across agencies. Optimizing these expenses directly inflates net profit.
5 Actionable Analytics Reports Every Agency Owner Needs
Here are the five highest-ROI data insights modern gas software provides distributors:
1. Delivery Route and Fuel Efficiency Analysis
By comparing liters of fuel consumed against total cylinders delivered per vehicle route, you can pinpoint inefficient routes. Consolidating nearby sector deliveries eliminates redundant vehicle mileage and vehicle wear and tear.
2. Commercial Account Turnaround Monitoring
Commercial customers (hotels, restaurants, cloud kitchens) frequently hold dozens of cylinders. If a commercial client takes 30 days to exhaust a cylinder batch that should be consumed in 10 days, your capital assets are sitting idle. Turnaround analytics flag slow-moving commercial accounts for prompt follow-up.
3. Consumer Drop-Off and Inactivity Alerts
When an active domestic customer fails to book a refill within their usual 25 to 40-day window, they may have shifted suppliers or experienced service dissatisfaction. Proactive outreach brings them back before they churn.
4. Ancillary Revenue Breakdown
Suraksha safety hoses, gas regulators, domestic gas stoves, and lighter sales carry higher percentage profit margins than cylinder delivery alone. Analytics highlight counter accessory conversion rates and help staff upsell essential safety gear.
5. Employee Settlement Accuracy Rating
Tracking shift reconciliation accuracy by delivery staff pinpoints who consistently tallies their cash and empty cylinders accurately versus who frequently has unexplained variances. Transparent performance metrics encourage accountability across your workforce.
How to Build a 10-Minute Morning Data Routine
You do not need to spend hours analyzing complex spreadsheets. A well-designed executive dashboard gives you a complete summary in minutes: today's bookings, godown stock levels, yesterday's cash collections, and pending delivery queues.
Reviewing these four key indicators every morning keeps your agency running with clockwork precision.
Written by LPG VAYAPAR Team
Business Analytics Specialist
LPG VAYAPAR is built by gas agency specialists to solve real-world daily distribution, stock tracking, and billing challenges for 685+ agencies across India.
Related Articles
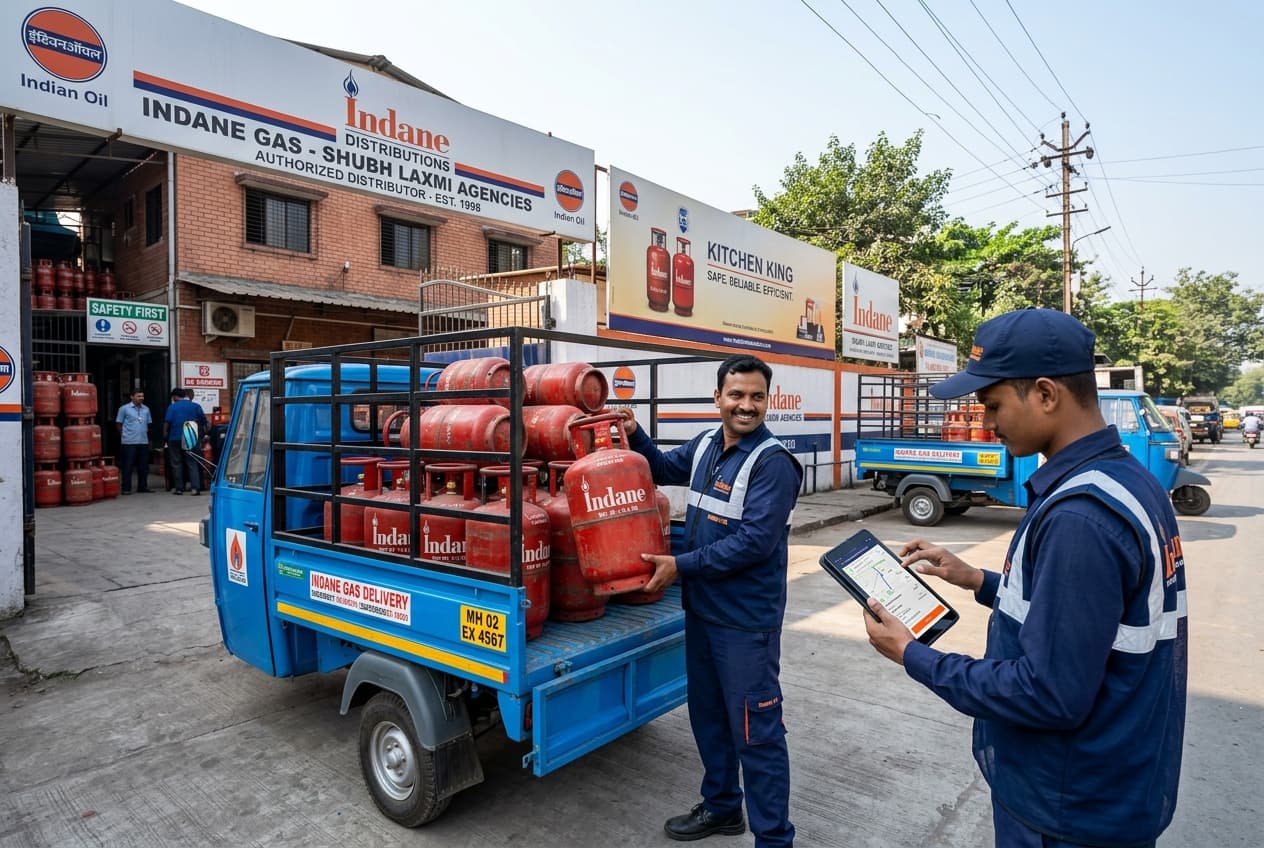 Operations
How to Reduce Delivery Errors by 95% with LPG Software
Manual delivery tracking leads to missed orders, wrong addresses, and frustrated customers. Learn how automation can eliminate these issues and boost your agency's efficiency.
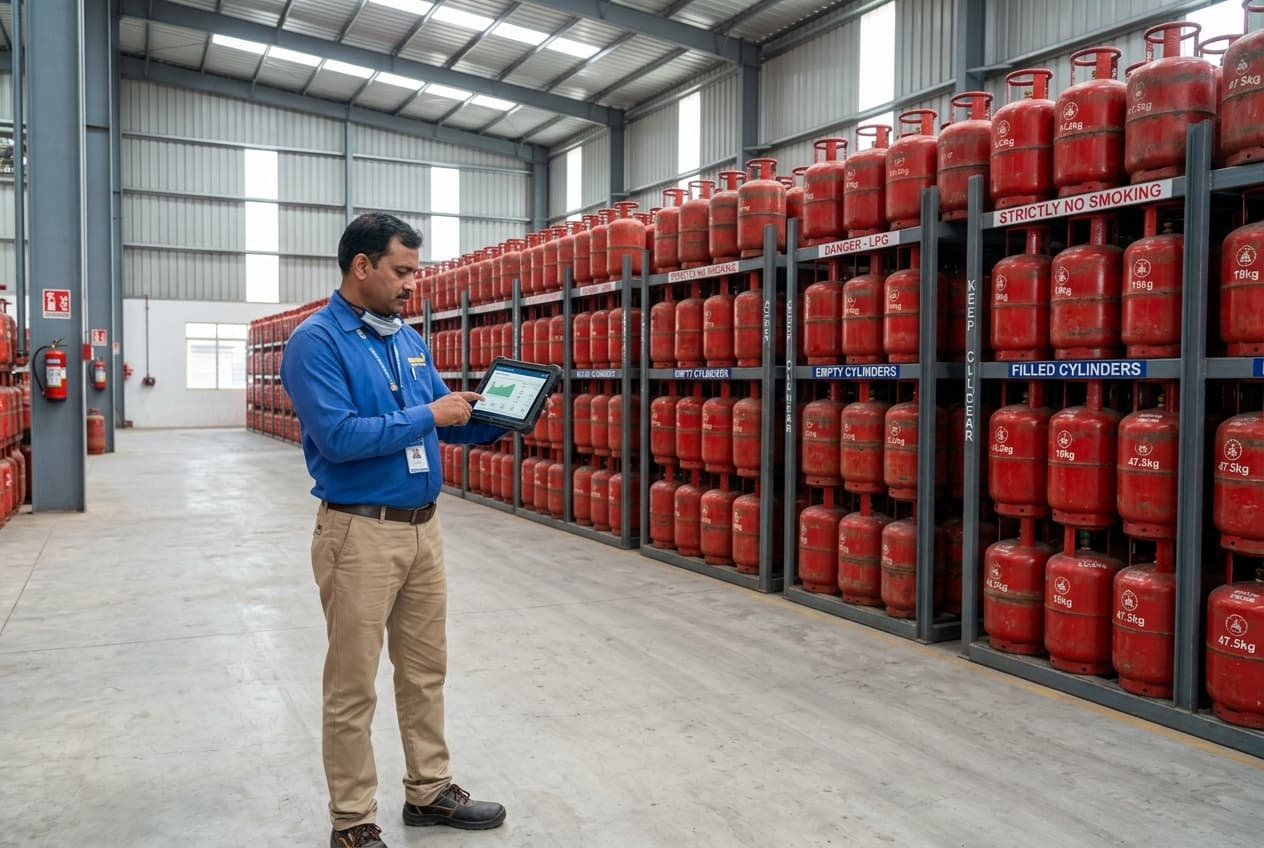 Inventory
The Complete Guide to LPG Inventory Management
Managing empty and filled cylinders shouldn't be a headache. Discover best practices for real-time stock tracking, low-stock alerts, and purchase returns.
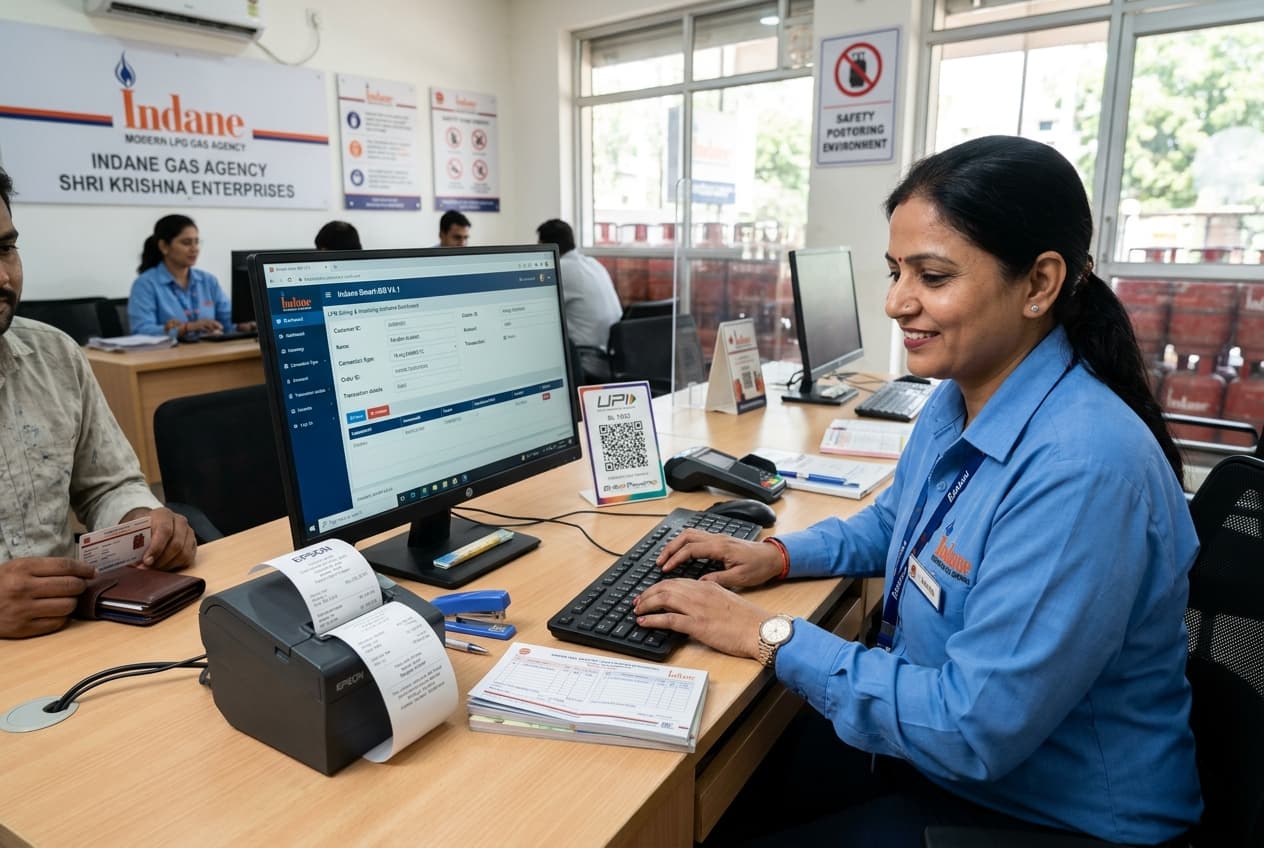 Billing
Digital Billing: Why Your Gas Agency Should Go Paperless
Paper invoices are slow, error-prone, and costly. See how digital billing saves time, reduces errors, and improves customer satisfaction.
Transform Your Gas Agency Operations Today
Join 685+ gas agencies across India saving hours every day, eliminating delivery mistakes, and boosting profits.